TAPE B CLOUD / THE KEY

Ask what the market is doing.
See the evidence.

* Informational only; not investment advice.

Explore a price move, a technical setup, or a market comparison. Tape B brings the evidence into conversation—and helps you distinguish what is observed, what is calculated, and what is interpretation.

Know where a number comes from, what a model assumes, and how far the evidence supports a conclusion.

Read-only market research. No trade execution or personalized investment advice.

Tape B blue and violet ribbon icon

Two ways to explore
market dynamics.

Choose between publicly accessible synthetic modeling with conceptual illustrations, or an authenticated analytical engine for provider-connected research.

Public · Synthetic3 Complimentary

Derivatives Modeler

Model hypothetical options positions with interactive calculations and conceptual illustrations. Three complimentary visualizations; additional credits do not expire.

  • Natural language scenario input
  • Interactive time, structure and volatility views
  • Payoff mechanics and modeled assumptions
  • No market data or brokerage connection required
Authenticated · Provider-ConnectedEntitlement Enforced

Tape B Intelligence

Investigate market observations, technical studies, and derivatives with source and timing context.

Authentication and data entitlements required.
  • Connected to market-data infrastructure
  • Quotes, candles, technicals, and options chains
  • Source, timestamp, delay, and coverage provenance
  • Read-only analysis without execution
Source
The connected provider
Time
Observation and available delay
Coverage
Fields your entitlement permits

A model you can
put to the question.

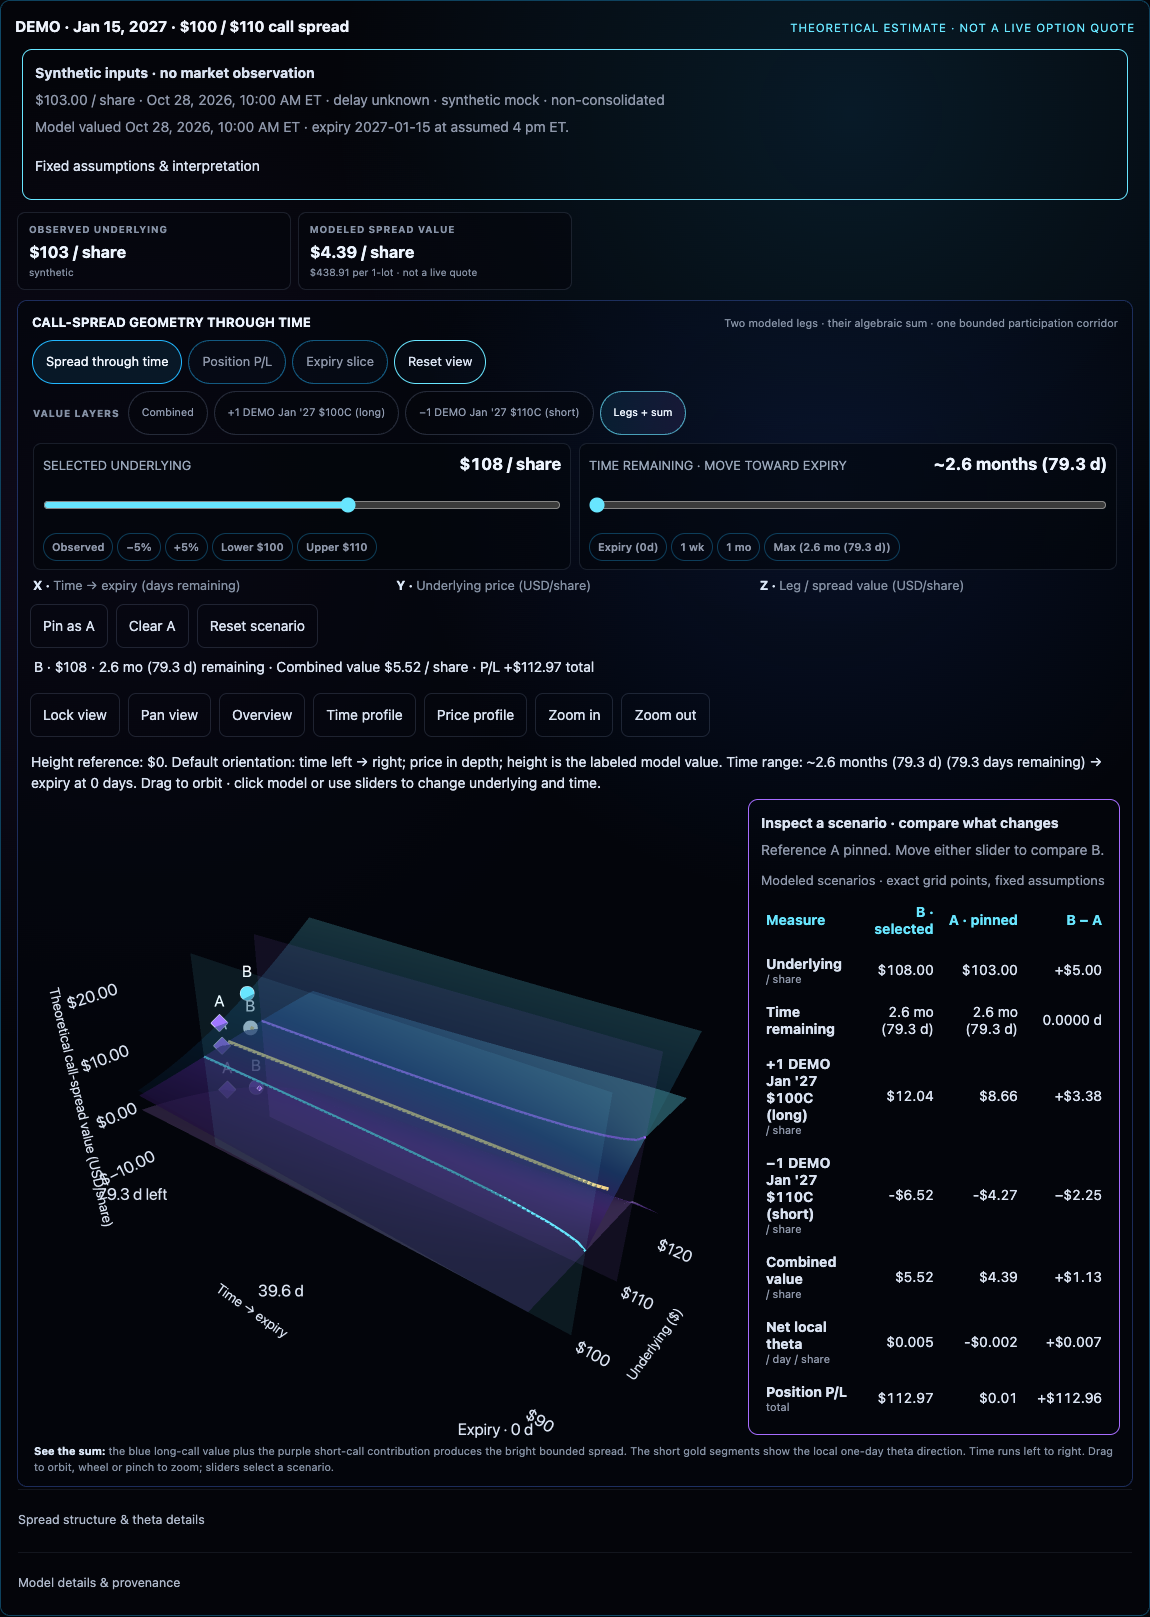
Rotate a call spread. Hold one scenario still while another changes. Inspect the relationship between the legs and the position.

DEMO / $100–$110 call spreadSynthetic · 3D
Call-spread value across price and remaining time.A three-dimensional projection of fixed synthetic Black–Scholes–Merton outputs. Underlying price ranges from $90 to $120, time from zero to 79.29 days, and theoretical spread value from zero to $10 per share. This is value, not profit or market quotations.Underlying price / $90–$120Days remaining / 0–79.29Theoretical value / $ per share

3D projection · interactive surface loads when in view.

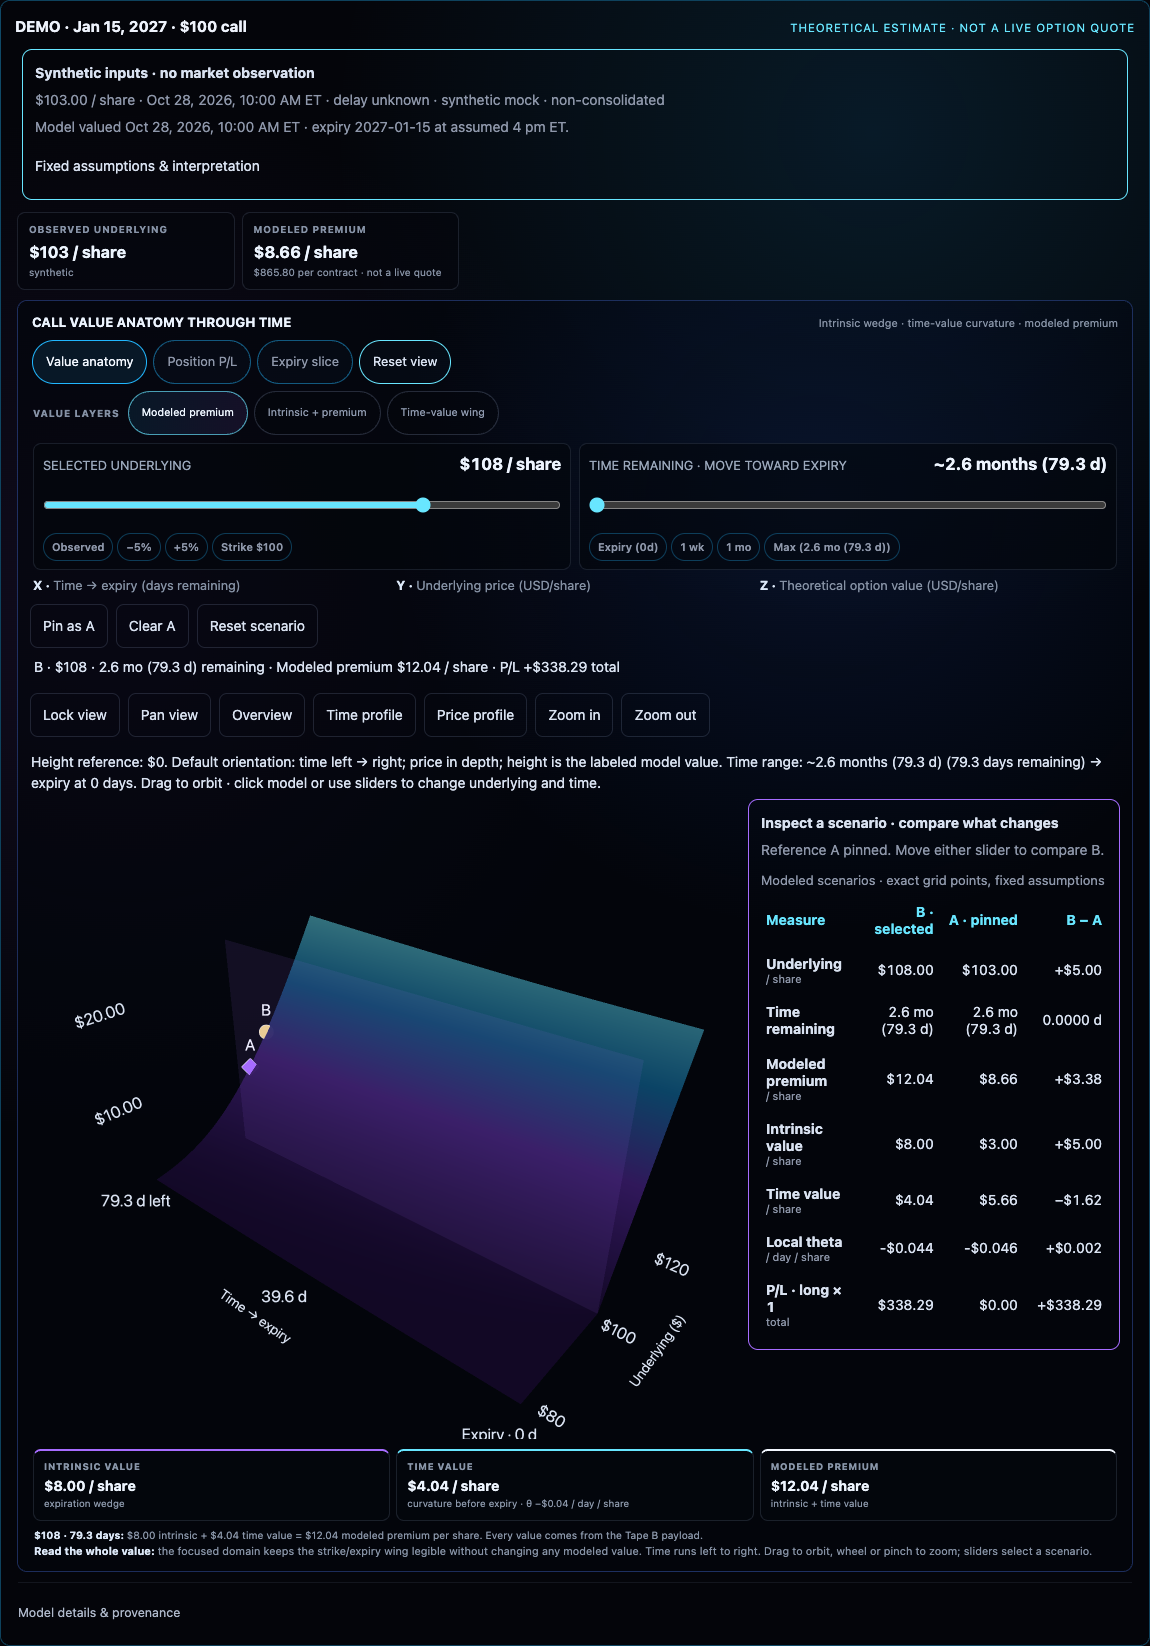
Explore the surface: drag to rotate; use the view controls to zoom. Fixed inputs: volatility 35% · rate 3.8% · dividend yield 0%. Synthetic study dated October 28, 2026; no market observations. Theoretical value, not P/L or a forecast.
Read sample model values
Theoretical spread value, $ per share
UnderlyingAt expiration79.29 days
$900.001.67
$1000.003.70
$11010.005.95
$12010.007.76
Try the 3D research instrument

Synthetic studies · Fictional DEMO inputs · No market observations or brokerage connection. Inspect the inputs and model limits.

Evidence has
a structure.

A market observation, a calculation, and an interpretation carry different kinds of authority. Tape B's method keeps those distinctions in view as the conversation develops.

  1. Observed

    What the data reports.

    Prices, candles, and quoted sizes from the connected source, with observation time and available delay and coverage information.

    Source · Time · Coverage

  2. Calculated

    What follows from the inputs.

    Indicators and modeled scenarios derived from stated inputs and assumptions. A model value stays distinct from a market quote.

    Inputs · Method · Assumptions

  3. Interpreted

    What the evidence suggests.

    A reading of the observations and calculations, expressed with the uncertainty they support. Conflicting or missing evidence limits the conclusion.

    Reasoning · Uncertainty · Limits

A framework is a perspective. Source-specific ideas retain their scope. An interpretation does not become a universal rule or a recommendation to trade.

Know what you're looking at.

A clearer question makes the evidence easier to read. The timeframe shapes which observations and calculations answer the question.

Daily prices are observations. Moving averages are calculations. What they suggest about a trend is interpretation.

Illustrative exchange
You
Is MSFT looking strong?
Tape B
Over what timeframe—today's price action or the longer-term trend?
You
Show six months of daily prices with the 50-day and 200-day moving averages.

Ask naturally.
Inspect precisely.

  1. Give the question a scope

    Begin with the instrument, timeframe, and market question you want to investigate.

  2. Examine the observations

    Tape B retrieves the available market data, identifies its source and observation time, and reports relevant coverage limitations.

  3. Follow the reasoning

    Explore calculations and supported visualizations, keeping model assumptions and interpretation distinct from the underlying observations.

Follow up to revisit the question with fresh observations.

Analysis* without execution.

The public Modeler and invited web beta do not connect to brokerage accounts or retrieve account balances, positions, or orders. Neither places, modifies, or cancels trades.

Access and data status. Tape B Intelligence requires an active invitation and provider entitlements. Availability, timing, and fields depend on the connected feed; observations and calculated or model-generated explanations may be delayed, incomplete, unavailable, or incorrect. Authentication does not grant exchange permissions or redistribution rights.

Read-only toolsNo brokerage accessNo trade execution

Private beta / 2027

The next question
belongs to you.

Tape B's current invitation-only web beta provides public-equity analysis* and illustrative option modeling. Recruitment for planned brokerage integrations targets January 2027, subject to development, provider agreements, and applicable approvals. The beta is free and read-only. New waitlist submissions are temporarily paused. Recruitment updates. Existing tester? Enter the beta.