
Pinned A. Selected B.
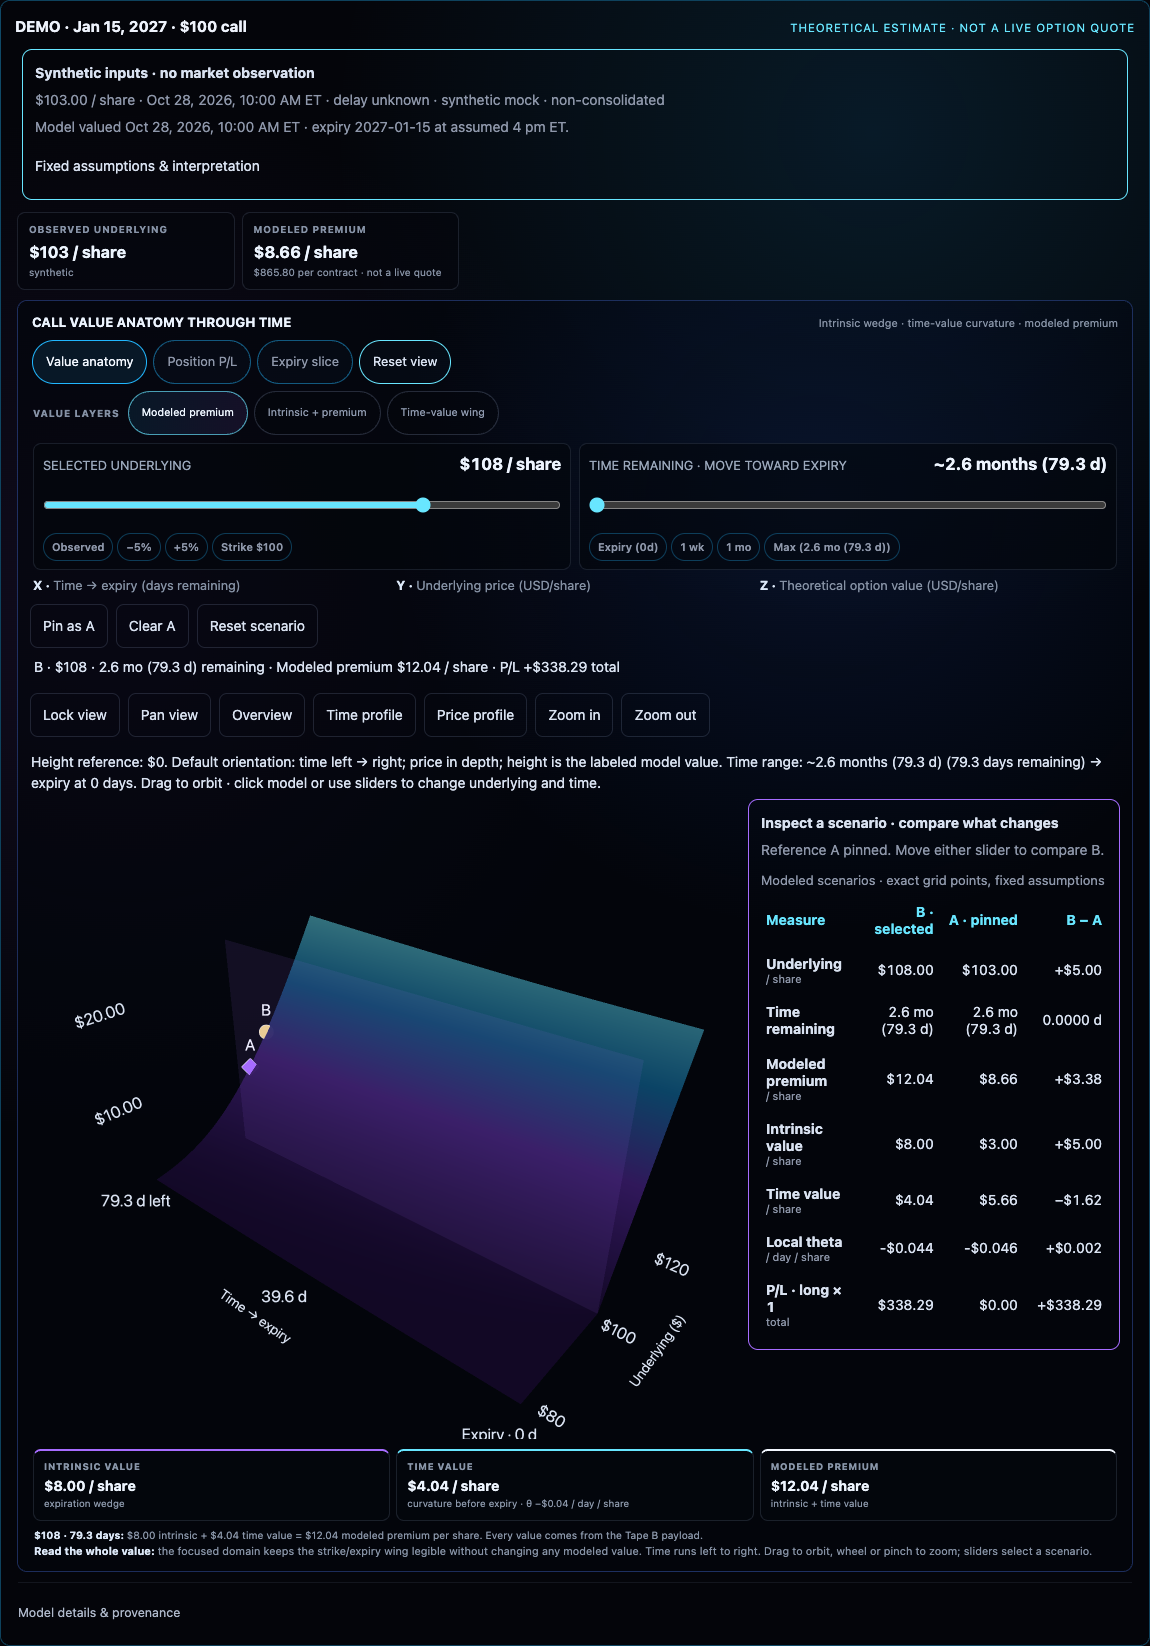
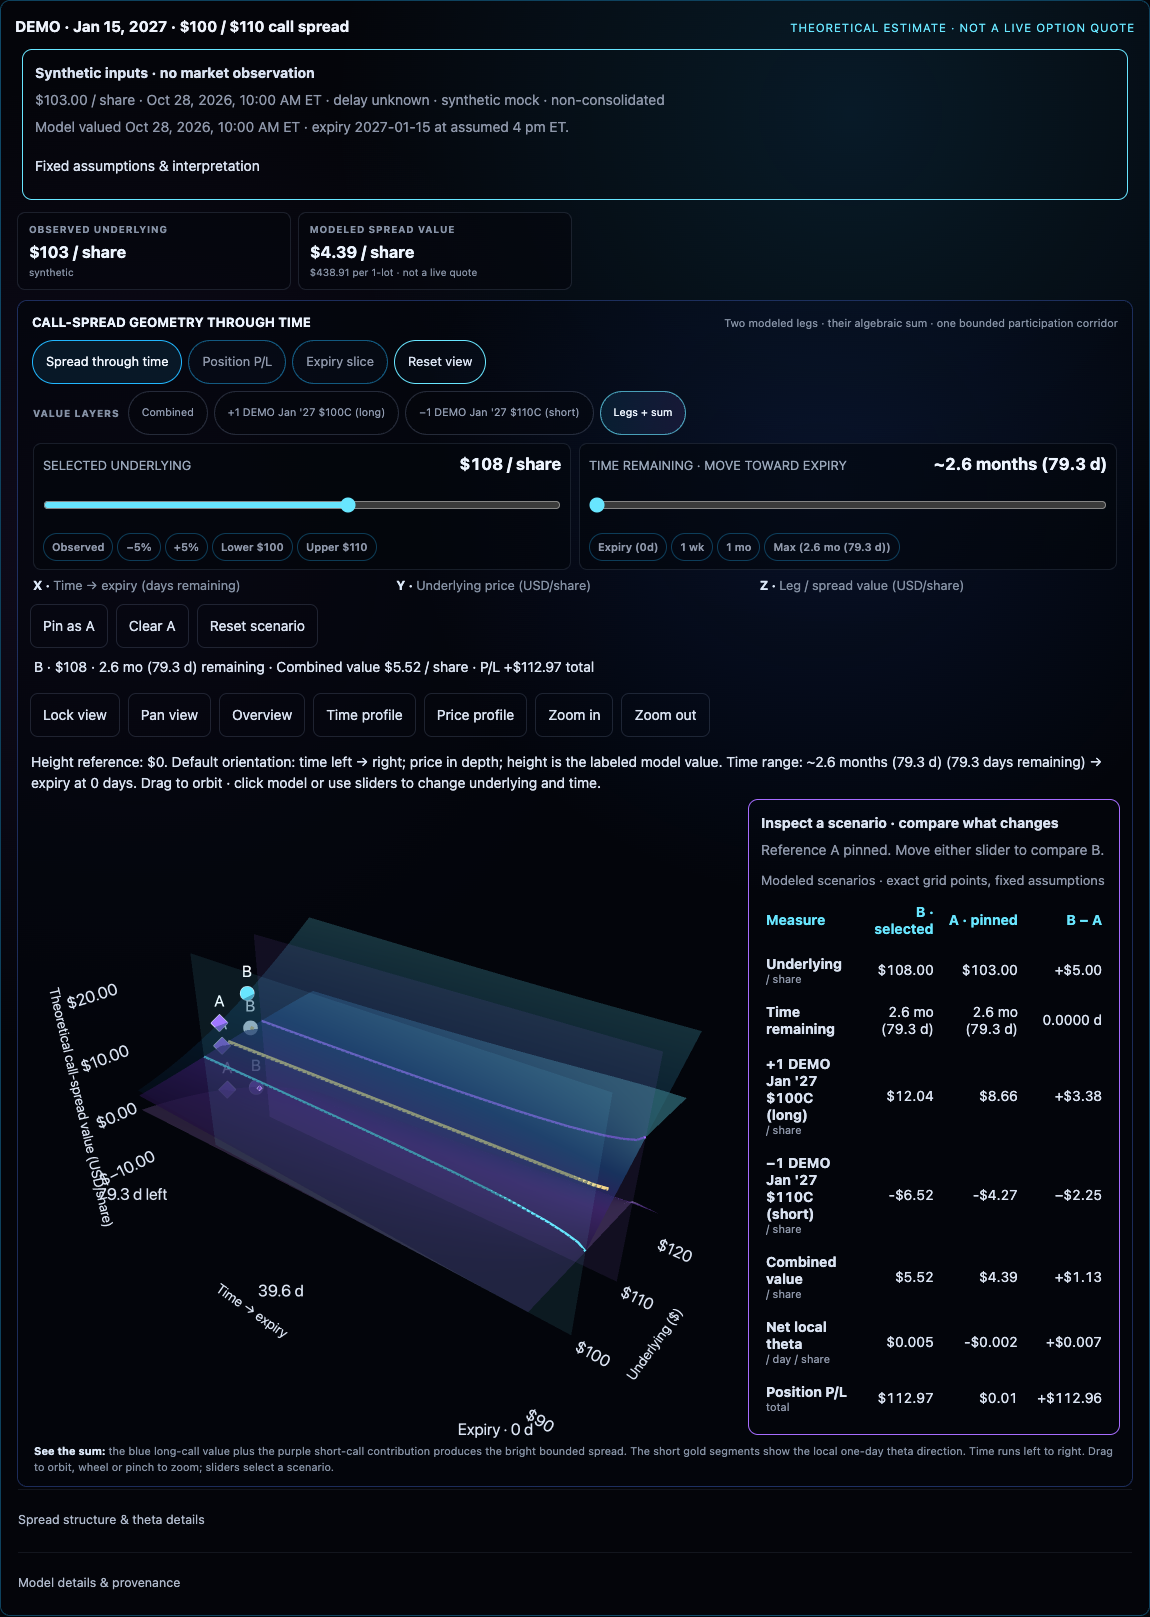
Pin the current price/time point as A. Move a slider or click a surface point to select B, then inspect B−A in a numerical table alongside both 3D markers. Pins last only for this session.
Tape B Cloud / Selected work
Two synthetic studies. One research loop: hold a reference, change a scenario, and inspect what follows.
Interactive 3D research · Synthetic models
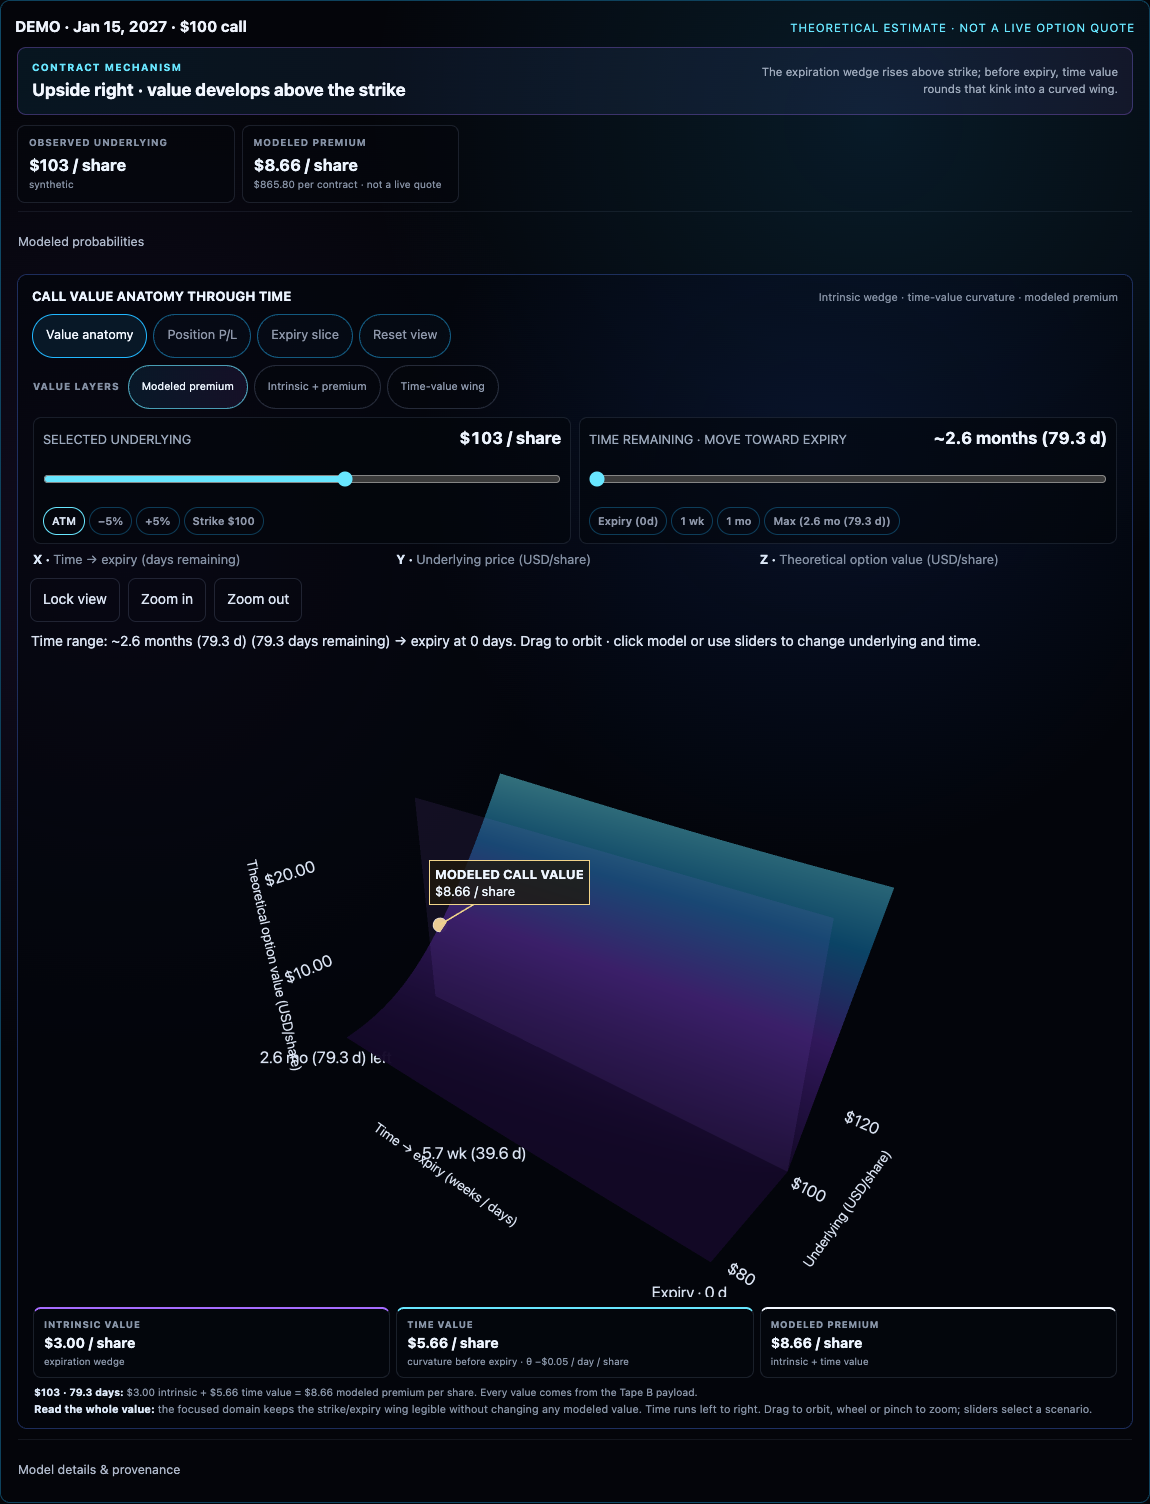
Tape B Cloud’s 3D research workflow keeps a reference scenario in view while you explore another price or time. The surface shows the structure; the A/B table explains the change in theoretical value and modeled position P/L.
Pin the current price/time point as A. Move a slider or click a surface point to select B, then inspect B−A in a numerical table alongside both 3D markers. Pins last only for this session.
Orbit, pan, zoom, or choose price/time camera profiles. Price and remaining calendar time select existing model grid points. View and scenario resets are separate.
Inspect intrinsic value and time value, then switch to modeled position P/L against a hypothetical model entry. These are theoretical estimates, not executable prices or expected returns.
Single selected scenario / Synthetic
 Inspect desktop capture
Pinned scenario comparison / Synthetic
 Inspect desktop capture
For one hypothetical long contract, the modeled P/L change is about +$338.29 before costs. The +5% shortcut selects the nearest grid price, $108, rather than interpolating to $108.15.
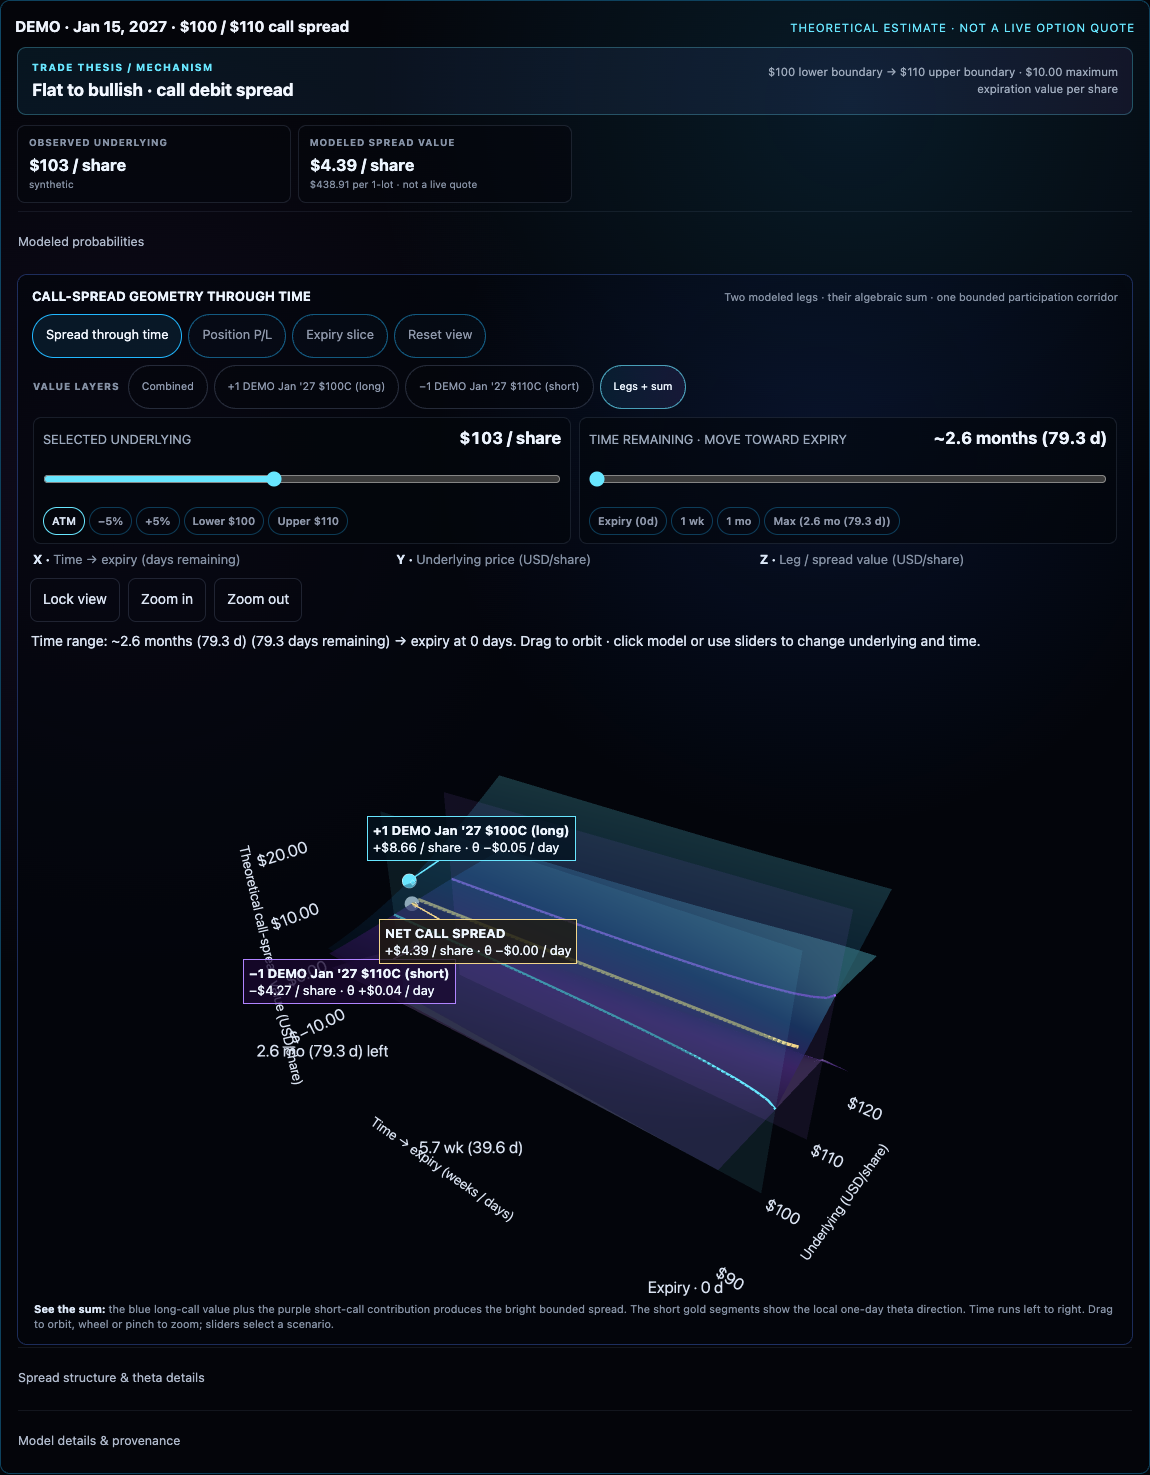
Single selected scenario / Synthetic
 Inspect desktop capture
Pinned scenario comparison / Synthetic
 Inspect desktop capture
The same price move can have different effects at different horizons. The combined theoretical value and modeled position P/L keep their own units and hypothetical entry basis.
Phone-sized browser captures use the same synthetic examples. These show browser layouts, not native assistant apps. Open an image to inspect it at full size.
 Single call · Single scenario
 Single call · Pinned comparison
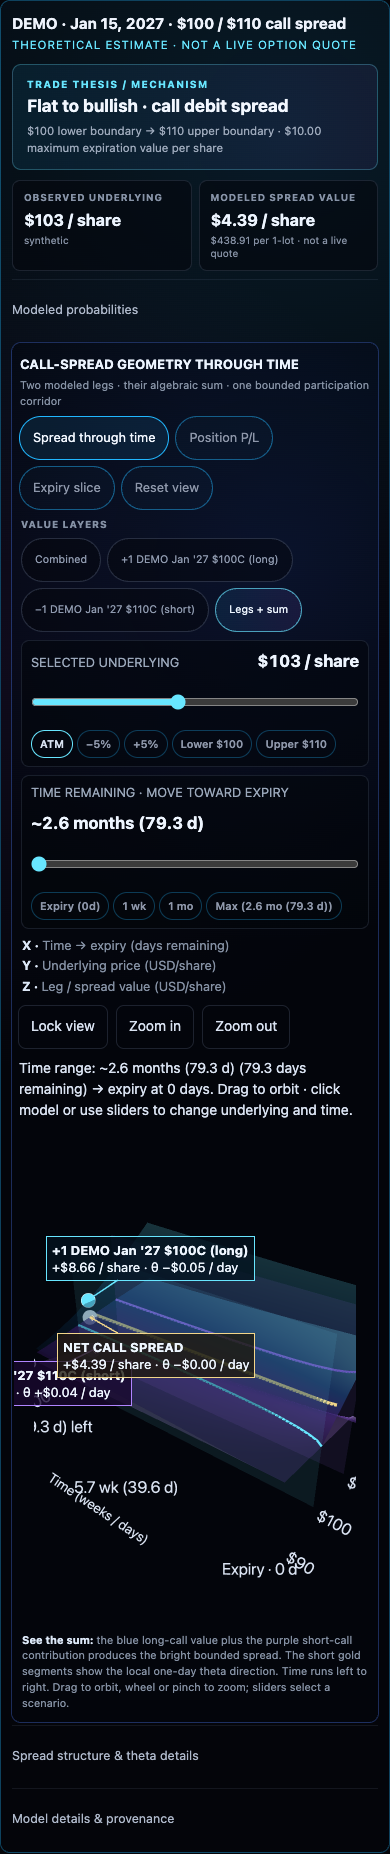 Call spread · Single scenario
 Call spread · Pinned comparison
Hands-on · Synthetic model only
Choose a fixed synthetic model, load it, then select Pin as A and +5%. Explore remaining time and switch to Position P/L. Sliders support arrow keys; the numerical table provides values alongside the 3D scene.
Explore fixed model outputs entirely in your browser. Loading a different model starts a fresh comparison.
Ready to load. The screenshots above remain available without WebGL or JavaScript.
Saved views retain the original model request, valuation and observation times, assumption origins, source context, and engine identity. Reopening recalculates that original request; it does not fetch a current quote. A/B pins, notes, and camera state are not saved.
Synthetic saved views are public. Provider-derived views stay bound to the owner or the original active invitation, with current Terms accepted and revocation checked when reopened. A different invitation does not grant access.
The interactive example above creates no saved link. Existing saved views retain their authorization and access protections.
Black–Scholes–Merton assumptions stay fixed while price and time change. Future volatility, discrete dividends, early exercise, assignment, liquidity, fees, and slippage are not simulated. P/L is a hypothetical model comparison, not a realizable return or a prediction.
The model floors displayed value at intrinsic while calculating sensitivities from the underlying formula. In some high-carry cases, those sensitivities can differ from changes in the displayed value. This demonstration does not model American early exercise.
Use the numerical comparison alongside the 3D surface to inspect each selected scenario and its assumptions.
All eight captures retain their original synthetic inputs and model outputs. The interactive example displays precomputed theoretical values from the fixed inputs above, without browser repricing. Informational only; not investment advice.
Help us understand recruitment traffic? With your permission, Google Analytics measures page visits. We do not send form answers to Google Analytics. Analytics privacy